Verdict
Yes, 75 per cent of Australia’s clean energy workforce is employed in occupations offering long-term and secure career prospects.
Analysis
There are around 25,000 people employed today across the small- and large-scale sectors of the clean energy industry in Australia.
Clean energy jobs in small-scale technologies and in the operation and maintenance of large-scale technologies provide long-term and secure careers, with growing demand for workers. Together, these two sections account for 75 per cent of the clean energy workforce.1
While construction projects are inherently time limited, many construction workers will travel from project to project, bringing expertise and experience.
Small-scale clean energy jobs: According to the Australian Energy Market Operator, by 2050, 79 per cent of households are expected to have rooftop solar systems.2 Workers in small-scale clean energy plan, design, install and maintain rooftop solar and home battery systems. They account for over half of the current clean energy workforce, and include engineers, electricians, trade assistants and roofers.3 Most work is in installation, with projects taking between 1-3 days to complete.4
The demand for new rooftop solar systems, maintenance of existing systems and end-of-life replacement is such that in most cases, this is secure ongoing work through contracting and subcontracting arrangements. This workforce is projected to increase from 11,000 workers today to 18,000 by 2050. Installations of household batteries are expected to increase, too, requiring workforce growth from just 2,000 today to 14,000 workers by 2050.5
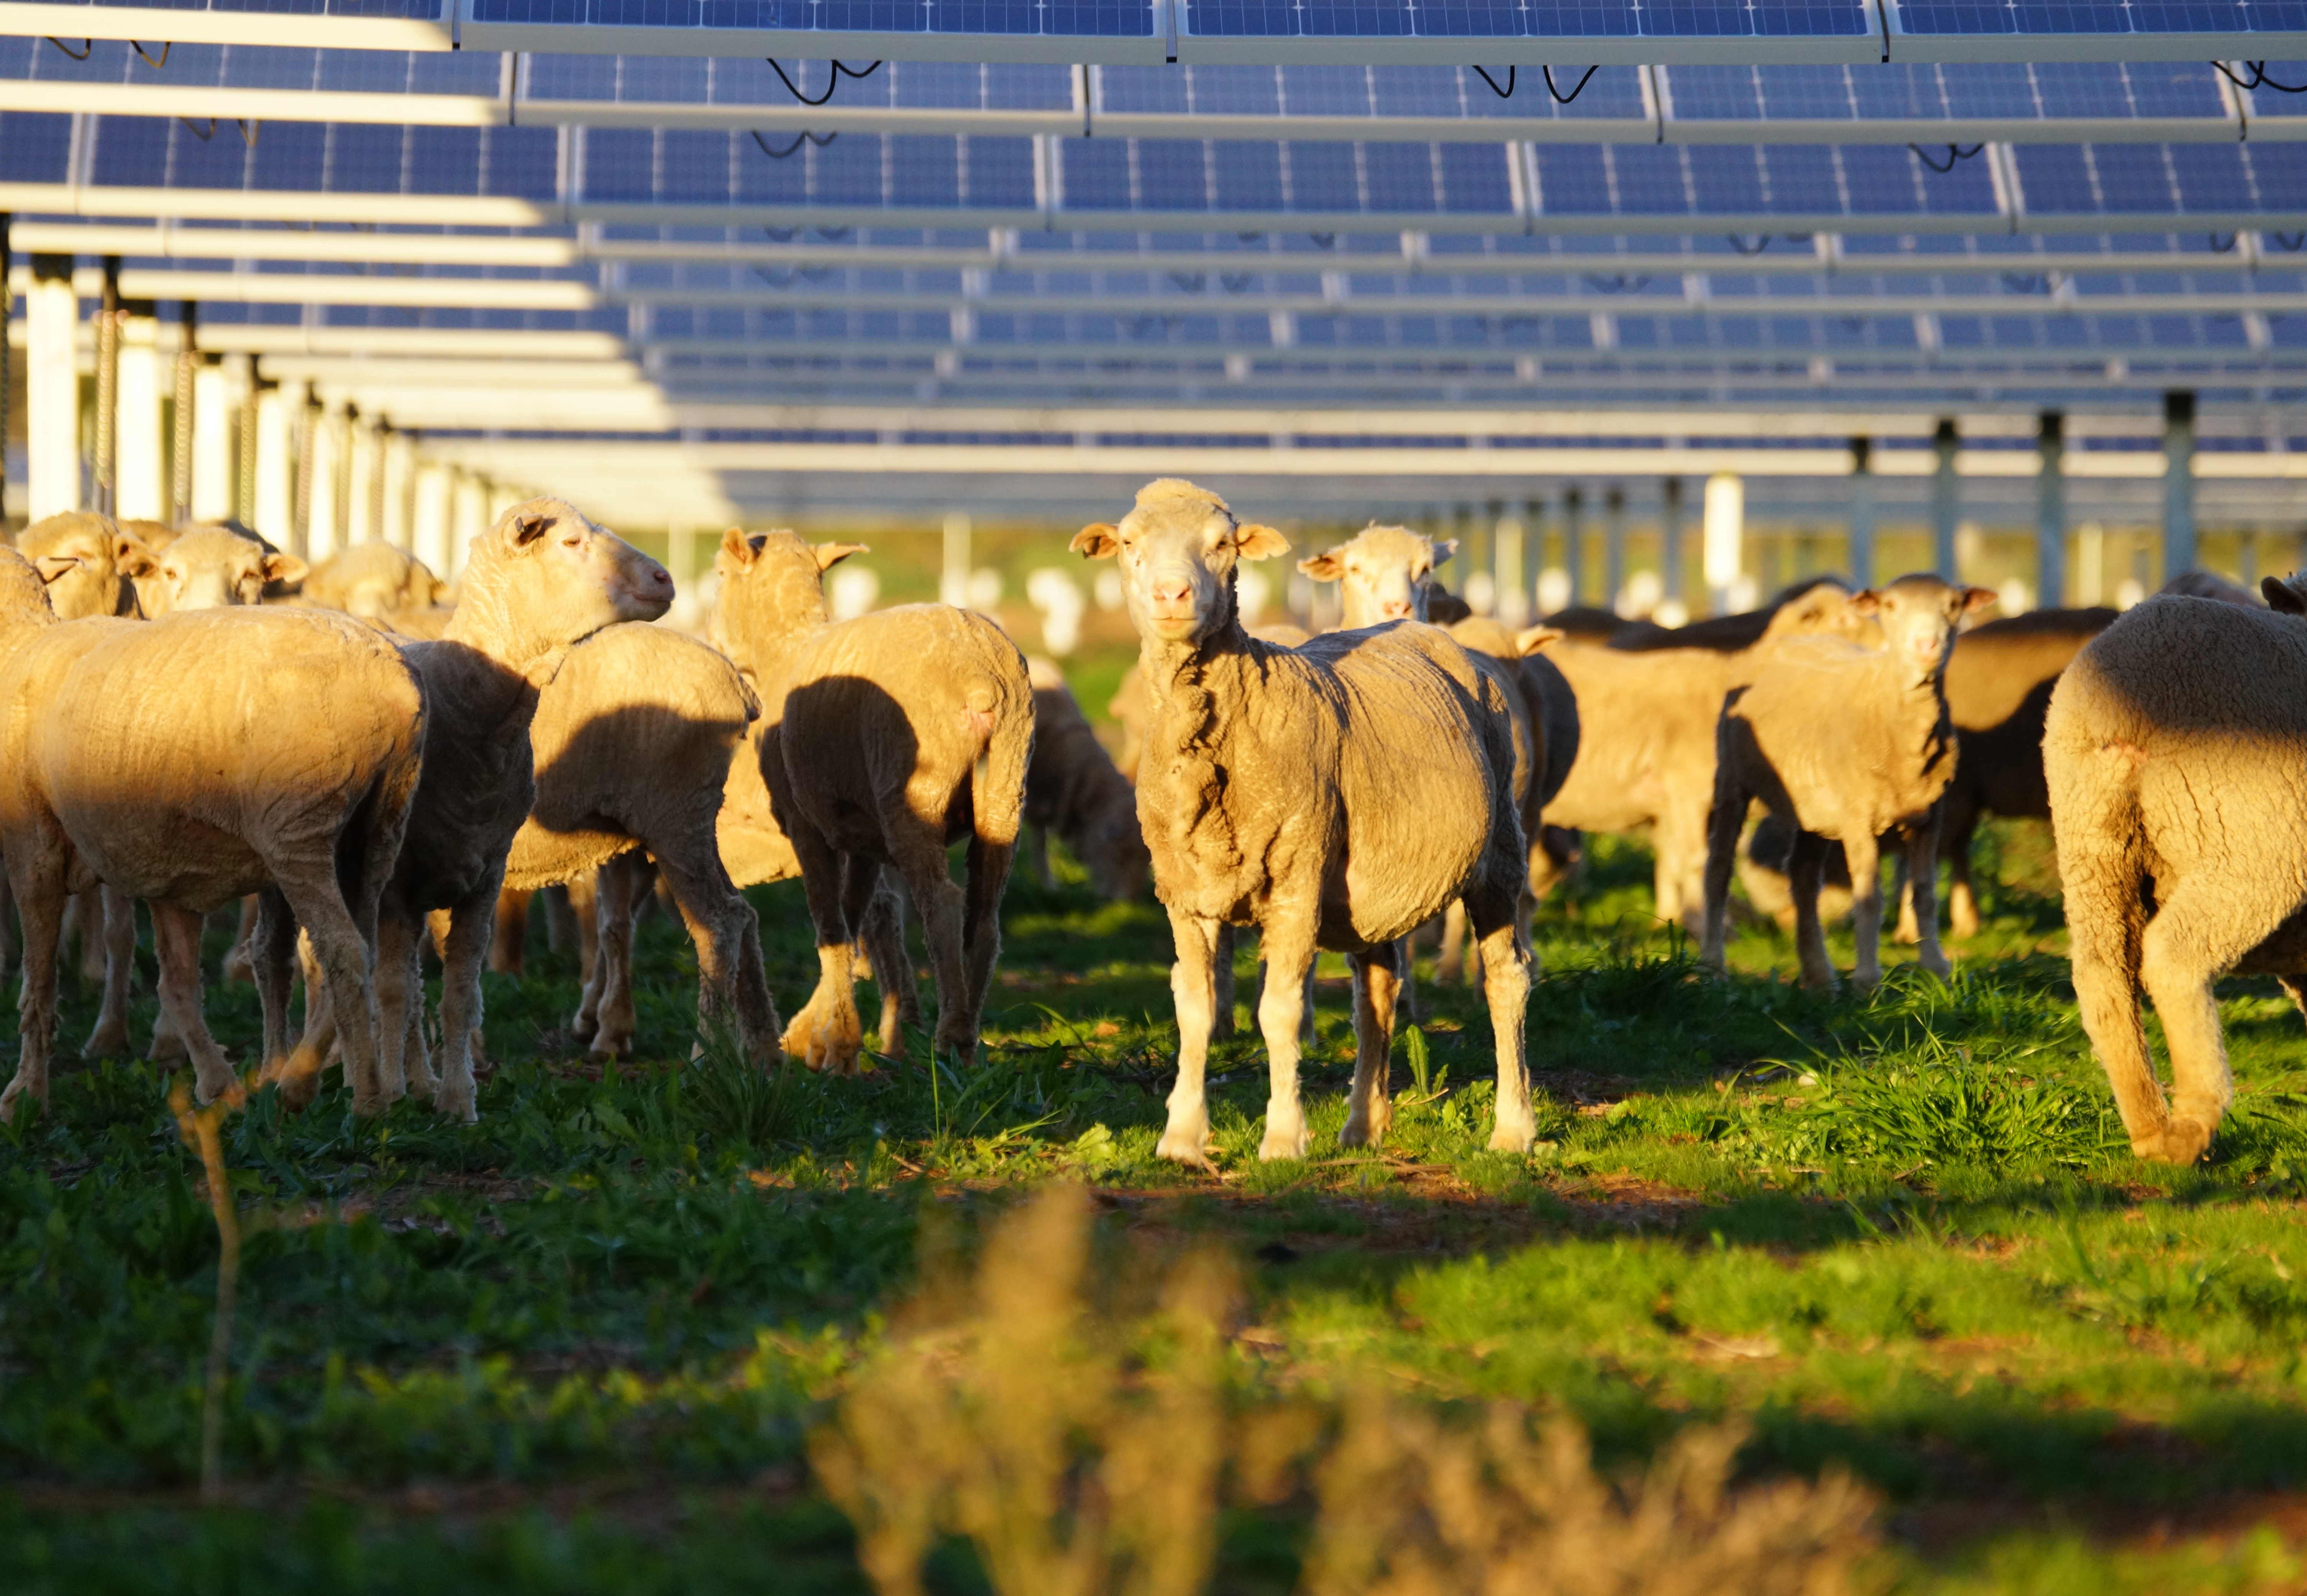
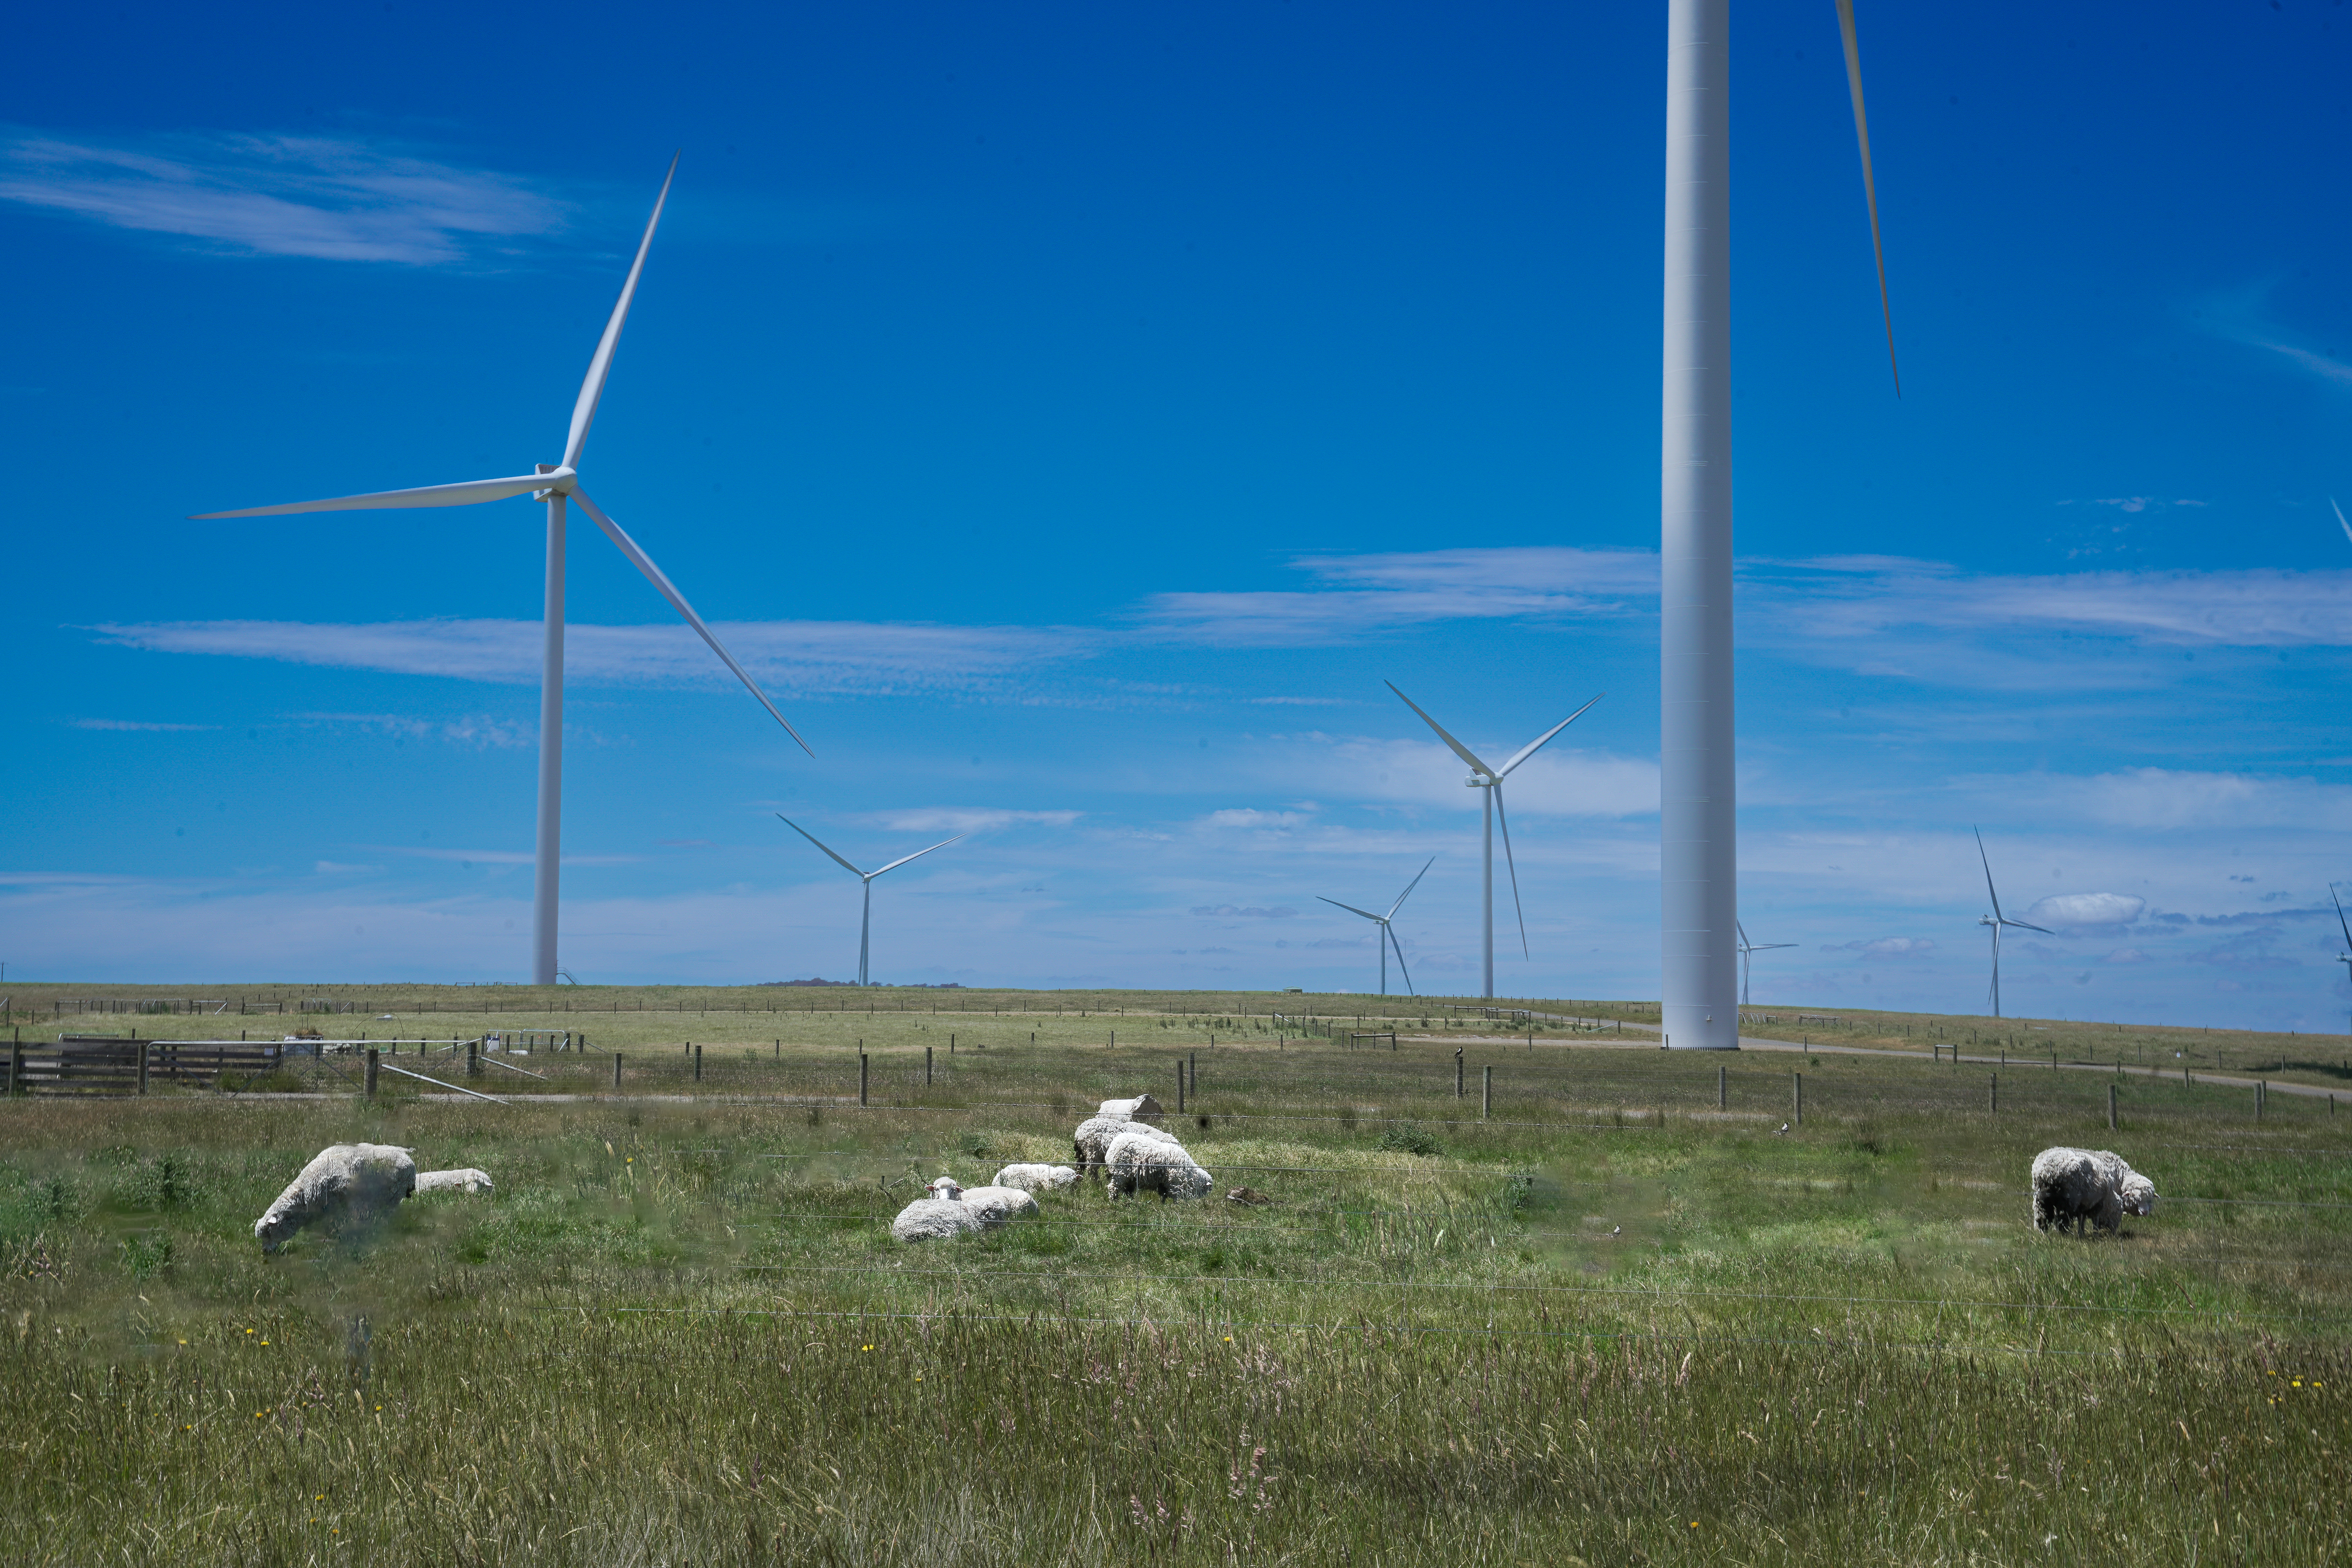
Large-scale operations and maintenance jobs: Workers are needed to operate and maintain large-scale clean energy technologies such as wind and solar farms, hydropower and grid-scale battery storage. They account for around 20 per cent of the total clean energy workforce.1 These careers persist throughout the 30-year operating life of the assets. This workforce will grow steadily as more generation, storage and transmission infrastructure is brought online, increasing from 4,000 workers today to 21,000 by 2050.5 Ongoing operations and maintenance jobs will account for most large-scale clean energy jobs by 2032.1
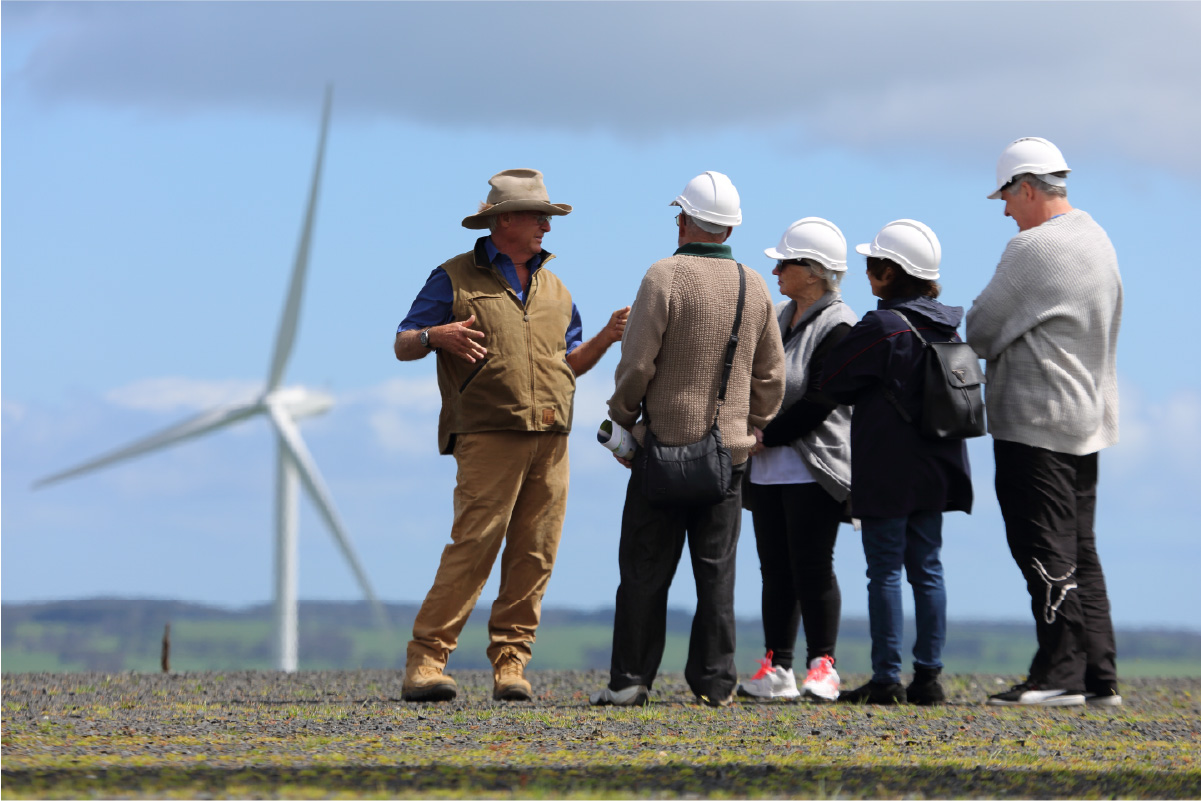
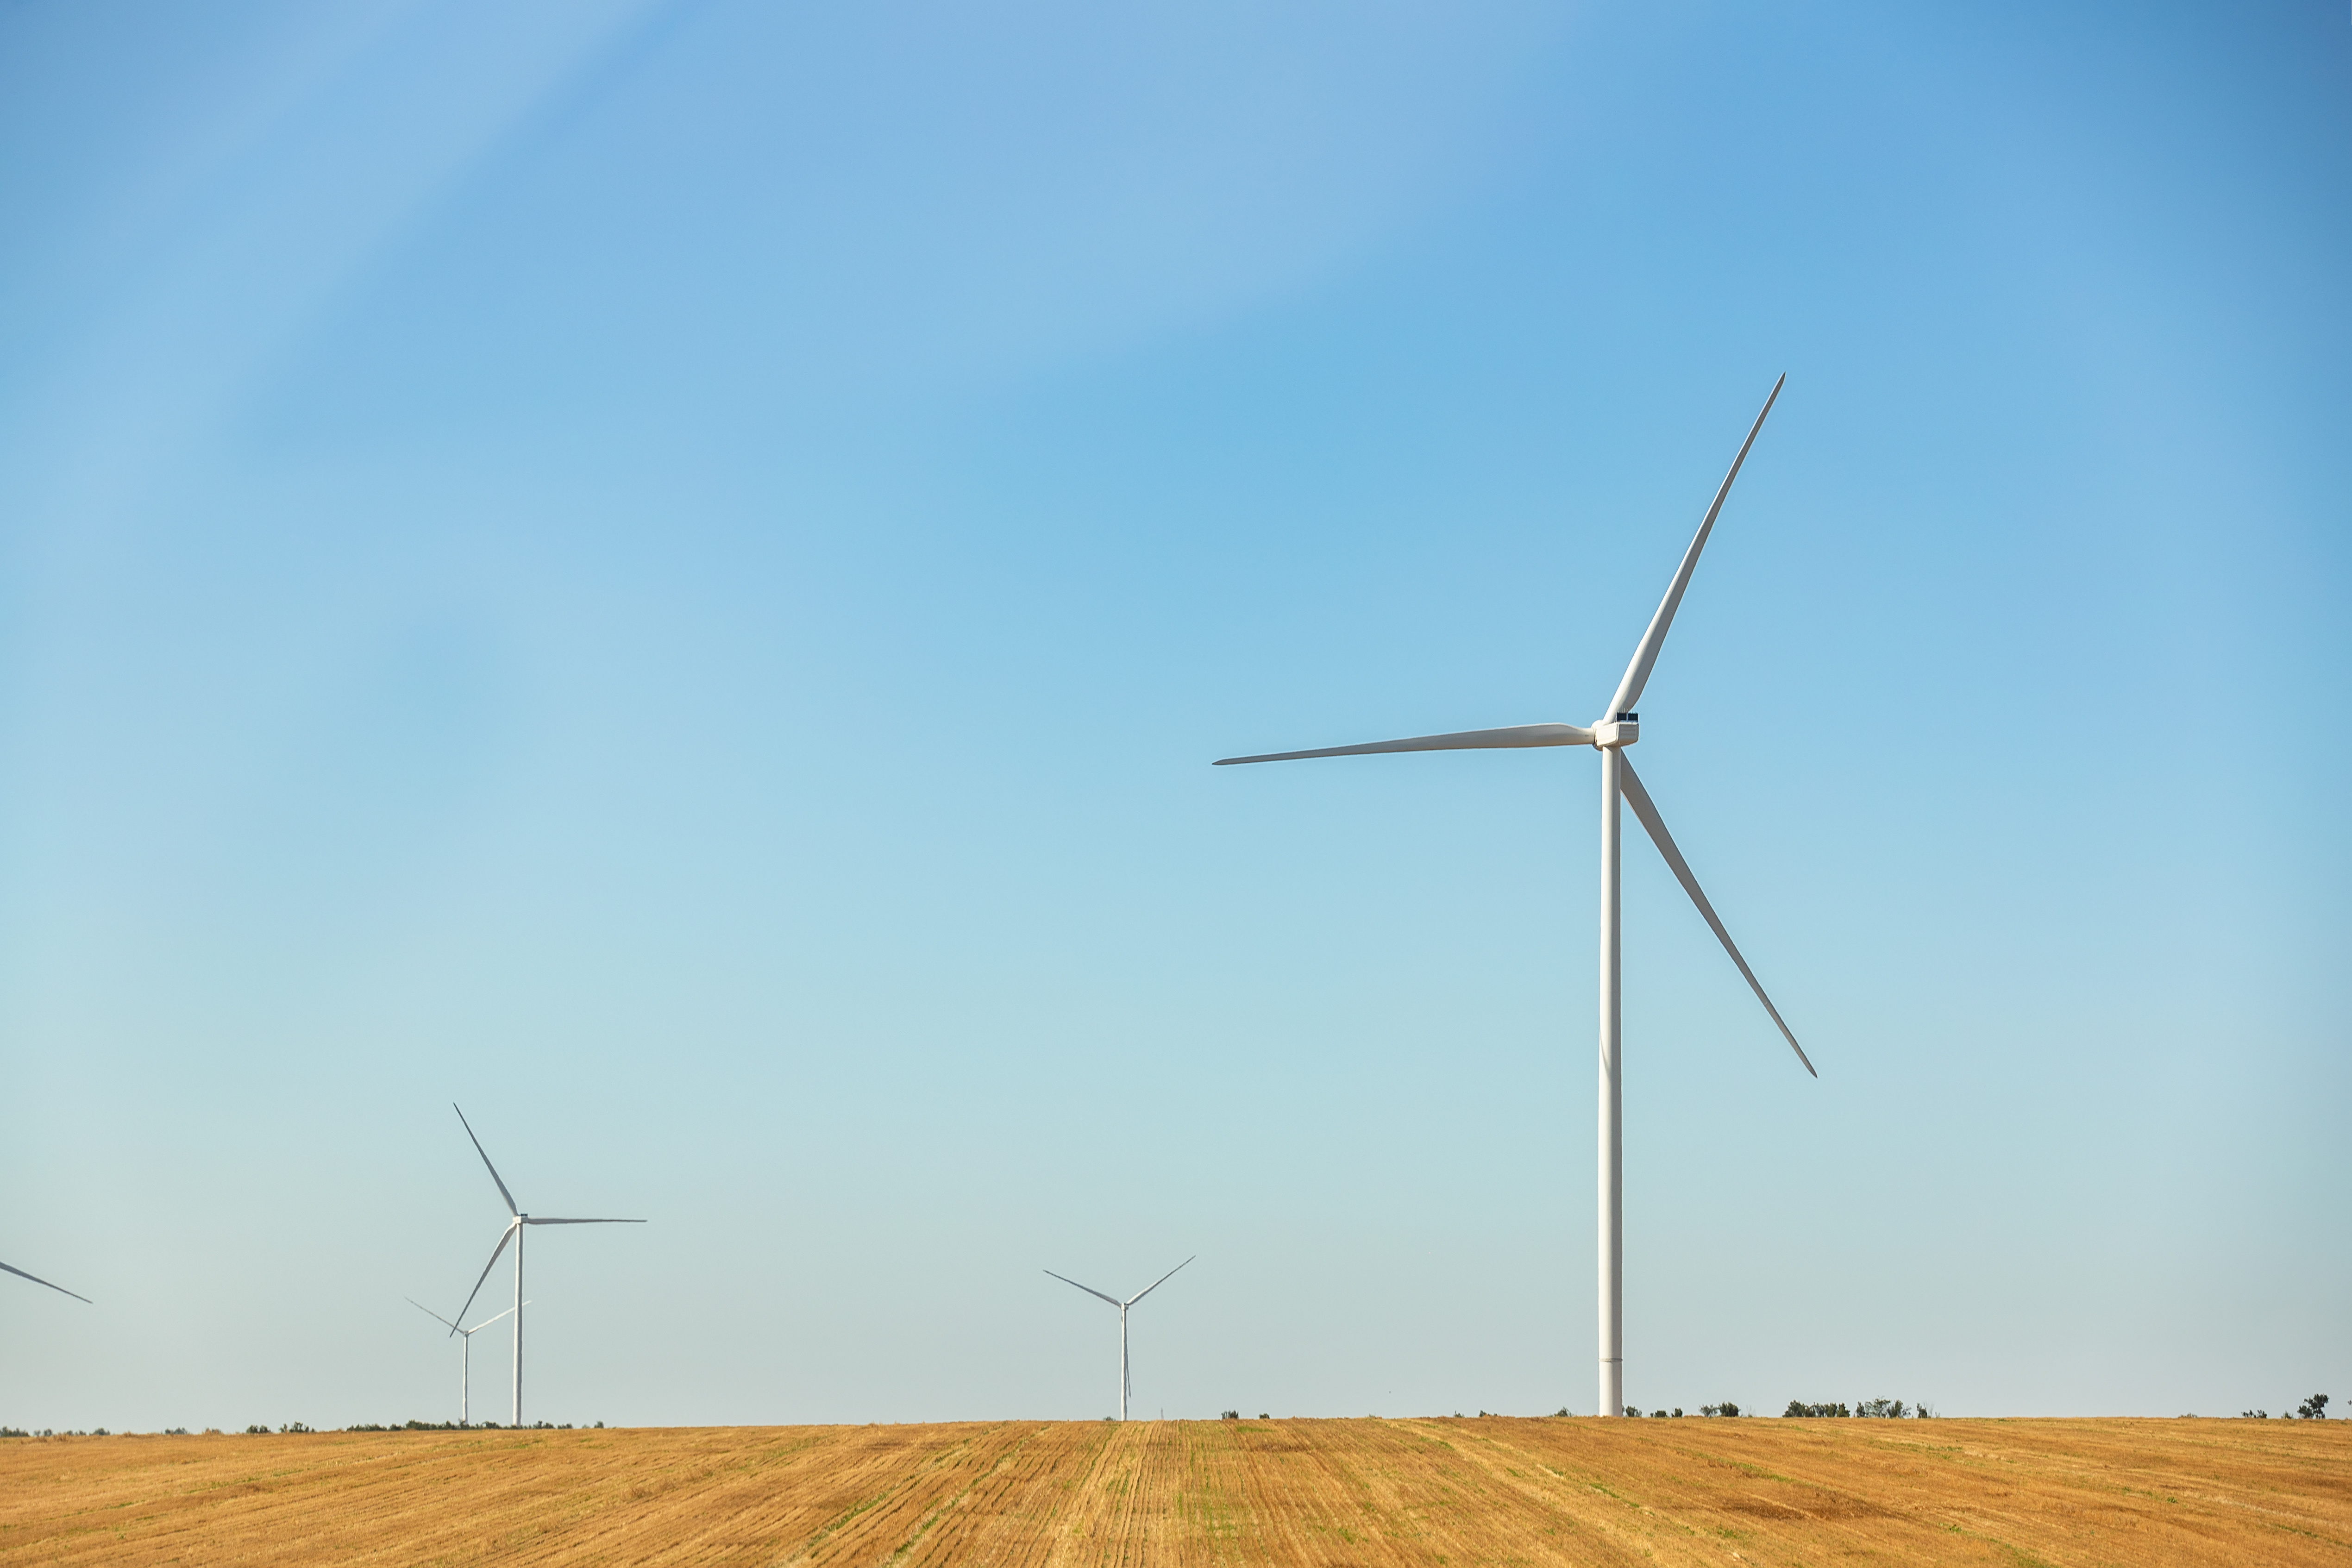
Large-scale construction and installation jobs: Constructing large-scale clean energy technologies currently accounts for around 25 per cent of clean energy jobs.1 This workforce will expand rapidly in the short-term due to the large number of construction jobs required. Replacing coal plants with clean energy requires around 8,000 wind turbines and 12 million solar panels by 2030.6 Large-scale construction and installation jobs are projected to peak towards the end of this decade, increasing from 6,000 to 30,000 workers. At this point, large-scale construction will account for around half of all clean energy jobs. Demand will reduce after this peak, with some jobs remaining to meet growing demand due to the electrification of sectors like housing and transport and repowering assets as they reach end-of-life.5 Construction projects are by their nature short-term, with workers moving to new projects when construction is completed. Construction workers have highly transferrable and in-demand skills and work on projects across a range of industries, including transport, energy, buildings and resources. Despite having a healthy pipeline of projects, energy accounts for just 11 per cent of infrastructure investment.7
References
1 – Rutovitz, J., Lara, H., Gerrard, E., Briggs, C. (2024a). Projected employment in the ISP and Australia electricity sector: workbook. URL: https://www.uts.edu.au/sites/default/files/2024-09/ISF-ISP%202024_Workbook_final%20v1.xlsx
2- Australian Energy Market Operator. (2024). 2024 Integrated System Plan. URL: https://aemo.com.au/energy-systems/major-publications/integrated-system-plan-isp/2024-integrated-system-plan-isp
3- Clean Energy Council. (2022). Skilling the Energy Transition. URL: https://stg-live.cleanenergycouncil.org.au/cec/media/background/resources/skilling-the-energy-transition-report-2022.pdf
4 – Department of Climate Change, Energy, the Environment and Water. (N.D.). Installation day and after. Accessed 5 February 2025. URL: https://www.energy.gov.au/solar/solar-retailers-and-installation/installation-day-and-after
5 – Rutovitz, J., Gerrard, E., Lara, H., and Briggs, C. (2024b). The Australian Electricity Workforce for the 2024 Integrated System Plan: Projections to
2050. Prepared for RACE for 2030. URL: https://www.uts.edu.au/sites/default/files/2024-09/NEM%202024%20Workforce_FINAL.pdf
6 – Assuming an average wind turbine capacity of 3.5 MW and solar panels capacity of 500 W. Installed capacity from Australian Energy Market Operator. (2024).
7 – Infrastructure Australia. (2024). Infrastructure Market Capacity Report 2024. URL: https://www.infrastructureaustralia.gov.au/sites/default/files/2024-12/2024%20Infrastructure%20Market%20Capacity%20report_1.pdf